Fashion companies use metrics like number of sessions per day, Conversion Rate, Average Order Value (AOV) and engagement rate to understand how the business is going. The Key Performance Indicators (KPIs) are the most important metrics, among all the other indicators, that companies monitor constantly to understand if the business is progressing consistently with the goals.

Author: Enrico Fantaguzzi
Co-founder and Director
Digital Fashion Academy
Former Gucci, Yoox, Tod’s
PMP(r), Prince2
- Ecommerce KPIs Vs. Bricks & Mortar KPIs
- Fashion Retail KPIs
- Digital Marketing KPIs
- Omnichannel KPIs how to measure the return of cross-channel activities
- Customer Service and Customer Experience KPIs
- The KPIs related to the costs of operations
- Customer Service KPIs
- Fashion KPIs by activity and function: Sales, Financial, Operations, CRM,
- Fashion Retail KPIs: Conversion Rate, UTP, Sell Through, ASP
- CRM KPIs
- Digital Marketing KPIs
- Engagement Rate and other engagement KPIs
- Micro Conversion KPIs
- Conversion KPIs
- Technological KPIs
- Digital Production KPIs
- Operations KPIs, logistics and customer service
- Commercial KPIs: Gross Sales, Net Sales and Gross Margin
- How to read the KPIs
- FAQs
- You may also be interested in
The majority of these metrics are available in Google Analytics, some others need to be calculated in a separate reporting system usually called Business Intelligence (BI). The Key Performance indicators usually tell us if the business is or isn’t going in the right direction, however sometimes they not sufficient to explain why the business isn’t performing as expected. In this case we need to use more granular metrics or associate the metric to other measurement parameters, such the dimensions.
Key Performance Indicator or KPIs are the most important metrics that a company look at to steer the wheel of the company towards success.
In this article we explore the a) traditional fashion industry KPIs then we move to the b) digital fashion KPIs and finally the c) omnichannel KPIs.
KPIs measure a company’s success versus a set of targets, objectives, or industry peers. KPIs can be financial, including net profit (or the bottom line, gross profit margin), revenues minus certain expenses, or the current ratio (liquidity and cash availability).
Investopedia
Ecommerce KPIs Vs. Bricks & Mortar KPIs
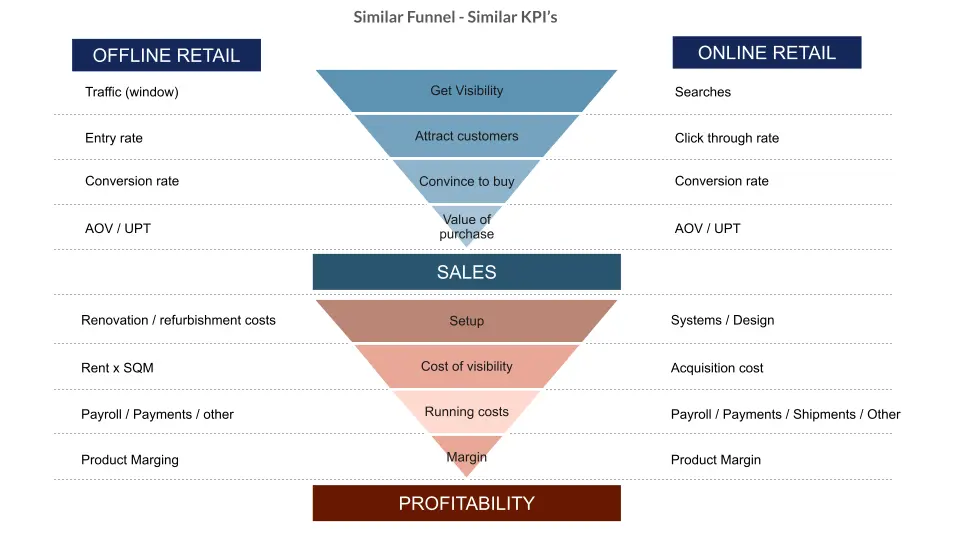
Comparison of the e-commerce KPIs vs the traditional fashion industry KPIS
Some of the Key Performance indicators for bricks and mortar stores are in common with the E-commerce channel, for example:
- Traffic or visits
- Conversion Rate
- ASP Average Selling Price
- AOV Average Order Value
- UPT Units per Transaction
Many other Digital KPIs are different from Bricks and Mortar for example: pages per session, number of add to cart, number of add to wish list, however it is possible to compare with similar metrics in the physical stores like: number of try on in the fitting rooms, time spend in front of a specific product or the number of requests for information that the store assistants receive.
We need to highlight also the peculiarity of the return rate: the return rate exists in both e-commerce and bricks and mortar, but the percentage of returns in bricks and mortar is quite little and therefore it’s not a critical factor for the success of the stores, while it’s very important for ecommerce.
Managers look at KPIs by comparing their values Year on Year to see if the company is improving its performance and also they benchmark the company’s performance against other companies and brands.
Fashion managers usually look at the average of the market as benchmark for each KPIs to understand how the company they work for is doing compared to other brands in the same market segment. But they also look at best in class performers to set their targets.
Fashion Retail KPIs
When we talk about fashion retail KPIs we generally refer to the performance of the retail stores. As for fashion business in general we need to look at Revenue metrics and Profitability metrics:
- Revenue per square meter
- Gross Margin
- Traffic on the street and traffic in the store
- Conversion Rate
- Units per Transaction UPT
- Average Order Value AOV
- Number of leads generated in the store
- Percentage of customer data acquired
- Sell Through
- EBITDA
- EBIT
Digital Marketing KPIs
Digital Marketing KPI: ROAS Return On Advertising Spend
The ROAS is a generic KPIs that monitors how much does it cost to acquire a customer using advertising campaigns. It measure the cost per sale dividing the revenue generated by the campaign by the cost of the campaign itself. So if you run a campaign and you spend 1000 and you earn 4000 the ROAS is 4. It’s very important that you decide what to include in the cost of this KPI, because the result will vary depending on it.
The ROAS, as return on the advertisement, is considered too generic by professionals of the digital industry. If you speak with Google consultants they might push the ROAS considering only the Google Advertising channels because they have no interest in including other channels in the calculation, let’s say Facebook for example. However you may want to do that to have a more comprehensive ROAS calculation.
If you run a lead generation campaign you should measure the Cost per Lead as KPI for the campaign. If you run a views campaign, that is, I want to show videos of products that can then be purchased on e-commerce, my KPIs will be the Cost per View on which I have to evaluate the results.
The return on ad spend on Google was once very high, in the early 2000s it was very easy to get 4, 5, 6 times returns on advertising investment which means a return of 400, 500 and 600 percent. Over the years, competition for the purchase of keywords has increased and therefore returns on investment have dropped due to the increase in the price of keywords.
The problem is that sometimes easy universal KPIs are sought, in reality it is necessary to verticalize the KPI package according to the area, and for each area, together with the specialists, define the KPIs with which to measure performance.
This is the parameter on which you measure your performance, you as an area manager have the task of achieving a result. So the KPI must be specific, for example I cannot measure the effectiveness of customer care with a KPI that measures the increase in sales of the online store. The goal is to measure the specific contribution that the area brings to the project.
The project manager must first of all define with each area manager which KPIs to use and secondly determine how to monitor them, for example by creating a KPI dashboard.
It is a job that takes a long time because it is necessary to define:
- Which KPIs to measure
- How to measure them
- Budgeting on KPIs
For example, we need to define specific objectives based on KPIs, for example:
- Increase in CR on mobile devices by X%
- Reduction of the return rate for size problems by X%
The project manager or department manager must then define the KPIs for the various activities in the value chain, focusing on the most important activities.
Another very important thing is that the KPIs must be understood and used by the whole team.
KPIs must be constantly maintained because they also depend on the market, for example the CPC has increased because competition has increased. So the KPIs must also be evaluated based on market trends otherwise I risk making bad decisions such as changing the marketing agency because we wrongly attribute the blame for the increase in the cost of campaigns to the marketing agency. Or I could decide to cut marketing investments on this channel, thus giving even more space to the competition.
The e-commerce Conversion Rate is not a universal data.
Finally, it must be borne in mind that the Conversion Rate of e-commerce is not always comparable between one company and another. Discussions like I do 1% and you 0.5% don’t make much sense, the average Conversion Rate changes according to the market and depending on the type of product we sell. In markets such as Germany and the United Kingdom where e-commerce diffusion is greater than in Italy, the average conversion rate of ecommerce is typically higher. It is therefore useless to compare the conversion rate of a company that sells 90% online in Italy with the conversion rate of a company that exports 90% to Germany.
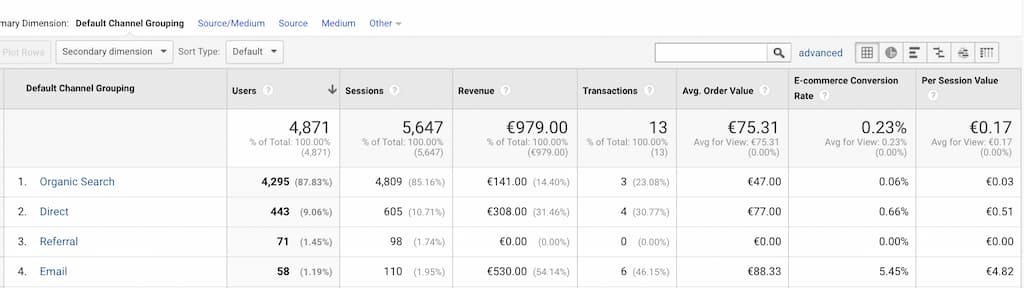
The Conversion Rate also depends on the acquisition channel.
The e-commerce Conversion Rate is also heavily dependent on the acquisition channel, for example the newsletter channel or the social media channel. The newsletter channel generally has a higher than average conversion rate as it tracks the sales of an audience that already knows the brand as it is subscribed to the newsletter. An advertising channel that targets audiences who are unfamiliar with our brand or product will generally have a much lower conversion rate.
Omnichannel KPIs how to measure the return of cross-channel activities
Omnichannel KPIs, is shipping from stores profitable?
Anne Critchlow, an analyst at Société Générale, says very few retailers have the ability to fulfill online orders in a cost-effective way using the stock found in stores. “Inditex has the technology to do this: its store network gives it the equivalent of more than 6,000 local warehouses that can ship orders quicker and at less cost because they are so close to customers,” she says. https://www.ft.com/content/
Anne Critchlo w, Société Générale
Omnichannel is on the lips of all fashion brands, and many brands and fashion retailers have implemented the so called Buy Online and Pick Up In Store aka BOPIS. Also the Buy Online and Return In Store (BORIS) is a frequent solution adopted by bricks and clicks fashion companies to drive more traffic to the physical stores.
But when we talk about shipping products from the stores it’s a different game. The costs of managing shipments from stores are generally higher than the costs of an e-commerce warehouse. So how do we calculate the profitability of omnichannel? What are the KPIs to use in this case?
The advantage of the omnichannel, however, is to be found in the optimization of the stock, and in the reduction of inventories that generate a cost for companies. On the other hand, using only the stock of the stores can constitute a barrier for the development of the digital channel.
The KPIs must therefore specific for the omnichannel activities, if they are generic and too synthetic they are not reliable.
To make sure we choose the right KPIs, we need to link KPIs to activities that are critical to achieving business goals, i.e. we need to relate KPIs to value chain activities that we need to do well to achieve business goals.
If we talk about the Ecommerce channel, the activities that we can consider critical for achieving the channel’s objectives will be for example:
- The creation of a high quality user experience, to be achieved through
- A nice and easy to use interface
- Advanced search functionality and filters
- Wealth of images and product information
- Page loading speed.
For an omnichannel activity you would need to factor in the cost per shipment, picking and packing cost,
All of these KPIs must be observed over specific time periods such as year over year, month over month, week over week, such as January over January of the previous year.
Customer Service and Customer Experience KPIs
Customer perception metrics are the cornerstone of mature brands’ CX
Forrester
measurement programs
Whether we decide to be customer centric or not, our customers will go ahead and make up their mind about how we’re able to meet their expectations. And then customer will decide wether to come back or move to another brand.
In this type of competitive scenario we need to use KPIs like Net Promoter Score (NPS). This type of measurements tells us how much customers are liking our products and services on a 1 to 10 scale in which we ask them how like would recommend out products to a friend of theirs.
It’s quite simple but quite accurate.
This type of Customer Experience KPIs is also used in China by Tmall for example. The online shop that meet a rating of at least 4.8 out of 5 are approved for taking part into the market place promotional campaigns. That’s a meritocratic criteria based on the customer satisfaction.
The KPIs related to the costs of operations
It is not enough to look at sales performance to understand if our e-commerce channel is achieving its objectives. It is also necessary to go into detail about the so-called operations or activities related to logistics, shipping, payments and customer service .
These activities constitute a very large slice of the management costs of an e-commerce and also determine the quality perceived by customers. For example, think of free shipping that has almost become a market standard, or think of a customer service that responds 12 hours a day via live chat.
An example: customer service in outsourcing
For example, if your company uses a customer service service from an external operator, it is likely to pay a price for each contact that the company receives, therefore for each minute of call, email or chat, the customer service provider case invoices the company for the contact cost.
If it takes 4 emails on average to resolve customer issues, your cost per issue will be 4 times the cost of a single contact. If you manage to reduce the number of calls or emails for each single issue by half you will also have halved the cost of customer service or at least the variable cost component.
Therefore, the number of contacts per case can become your KPI for customer service
Customer Service KPIs
You should measure the performance of the Customer Service team using specific metrics
- First Response time (FRT)
- Average Waiting time (AWT)
- Average Resolution Time (ART)
- First Contact Resolution Rate
- Escalation Rate
- Order/Ticket Ratio
- Volume by Channel
- Categorization / Top Topics
- Total Tickets and Tickets Per Customer (costs)
For a deep dive into Customer Service metrics, KPIs and Customer service management go to our course: Customer Service Management for Fashion
Fashion KPIs by activity and function: Sales, Financial, Operations, CRM,
- Sales KPIs
- Gross Sales
- Net Sales
- Returns
- Gross Margin
- Financial KPIs
- Contribution Margin: Net sales – Variable Costs
- EBITDA: earnings (or profit) before Interests, Taxes, Depreciation quota and Amortisation quota
- EBIT: earnings (or profit) before Interests, Taxes
Fashion Retail KPIs: Conversion Rate, UTP, Sell Through, ASP
From average selling price to store traffic
Store Traffic is the number of visits that a store receives per day / week / month. It’s essential that a store is palced in a location that is able to generate traffic. Department stores, Outlet villages and the Main commercial streets in the cities have accurate data about the traffic that they are able to generate and that determines also the cost of rent of a shop.
Conversion Rate is the number of orders that a store is able to generate divided by the number of persons that entered the store in the period of time. If a person enters twice it counts for two. This is important to understand because also in the ecommerce KPIs the number of visits is different from the number of visitors. Learn more about Conversion Rate.
Sales per square foot are and indicator of the sales performance of a store in relationship with its size in square feet or meters. It is used to compare the performance between two or more stores. For example we can compare two stores with different internal visual merchandising layout and determine which one performs better. Also the introduction of digital and ecommerce elements in the store can be a factor in the sales per square foot performance.
Leads generated are the number of people who signed up to receive news from the company it can be calculated in terms of forms filled out, email address collected, apps dowloaded, followers. It’s mainly a digital KPI but it is more and more relevant to bricks and mortar stores as they become more similar to media or touch point.
Units per Transaction (UPT) and Average Order Value (AOV) are metrics that measure the ability to Cross Sell and Up Sell. If a person comes into your store to by a jacket and you are able to sell her also a shirt you are doing Cross Selling, if a person comes into a store with the idea of buying a 200 Euros jacket and you sell him a 300 Euros one you are doing Up Selling.
Sell Through Rate is the number of products sold divided by the number of products bought as initial stock plus replenishments. It is monitored during the season to track the progress of the sell out of a product category, a collection or specific products. It’s the buyer’s responsibility and objective to optimise the sell through rate.
The benchmark for sell through is 80% of sell through means a good performance of buying, more than 80% ST you are loosing opportunities, due to the fact that your stock of products by this point is missing some sizes therefore you are missing sales due to lack of sizes available.
References
CRM KPIs
The customer relationship management has 3 goals: A) increase the customer base; B) increase the value for each single customer; C) Reduce the Churn rate. Churn Rate is the percentage of customers that do not return to store or, in other words, the number of customers that abandon the brand over time. The CRM activities are located mainly in the lower marketing funnel where we find the Conversion, Loyalty and Advocacy strategic marketing goals.
- Cost per Lead (CPL)
- Email Opening Rate
- Email Click Through rate
- Churn Rate: it’s a negative KPI, it must be reduced.
- CLV Customer Lifetime Value
- Frequency of purchase
Digital Marketing KPIs
- Return on Advertising Spent (ROAS)
- Cost per Acquisition (CPA)
- Cost per Click (CPC)
- Number of sessions
Engagement Rate and other engagement KPIs
- Engagement rate: the engagement rate has replaced the bounce rate in Google Analytics 4 and it’s used in the opposite way compared to the bounce rate. The engagement rate measure the percentage of visitors of your website or app that engage with your website or app. In other words the engagement rate measure the people who either read 2 or more pages of your website or the take some other actions like scrolling or clicking. The engagement rate is strictly related with the time spent on site and number of pages per sessions and it helps to determine the brand equity.
- Bounce rate
- Pages per Visit
- Page Exit Rate
Micro Conversion KPIs
- Add to cart
- Add to wish list
- Add to cart from wishlist
- Check out funnel completion
- Newsletter subscriptions
- Account creation
Conversion KPIs
- Conversion Rate
- Ratio product views / product purchases
Technological KPIs
- Site speed
- Page Load time
- Server Response Time
- Conversion Rate per Device type (Mobile, Tablet, Deskto)
- Conversion rate per Screen resolution
Digital Production KPIs
- Digitization Lead Time
- Cost per photo
- Cost per digitised product
Operations KPIs, logistics and customer service
- Number of contacts managed and closed
- Number of customer care contact per order
- Time to pick up and ship
- Number of on time delivery
- Number of claims
- Number of parcels lost
Commercial KPIs: Gross Sales, Net Sales and Gross Margin
Gross Sales, is the monetary value of the sales of a period of time, usually compared with the same period of the previous year. It can be measured also in number of units of products sold. The ratio of sales versus last year (LY) is a percentage e.g. +8% vs. LY.
Net Sales, is the monetary value of the sales minus the returns of a period of time, also measured period vs period as for the Gross Sales above. It is the real KPI to measure the performance of the e-commerce channel because the Returns are a characteristic part of e-commerce.
Returns are the percentage of products returned vs the products sold, it is usually calculated in numbers and monetary value. Returns are characteristic part of e-commerce as the customers have the right to return a product bought online.
Gross Margin is the result of Net Sales minus Cost of Goods Sold (COGS). Is the first indicator of a business profitability i.e. the sales minus the cost of the product sold. The rest of the costs that a company has to sustain such as marketing and rent are not included in the Gross Margin.
Financial KPIs: EBITDA, EBIT.
EBITDA it’s a profitability indicator that Investment companies generally use to establish the profitability of a company. EBITDA stands for (Earnings Before Interest, Taxes, Depreciation and Amortization). The general rule is that if a company is able to manufacture goods, sell them and have money left to pay the depreciation cost of the investment it means that the business is sustainable in the long term. This KPIs is frequently used for the evaluation of a company on the market.
EBIT, it’s a profitability indicator that takes into account all the costs that a company needs to sustain in order to manufacture and sell their products on the market, including the depreciation. So for example if we need to build up a bricks and mortar store or an e-commerce platform to sell our products the EBIT will be calculated as Sales – COGS – Annual depreciation quota of the investment (Accrual)
How to read the KPIs
We don’t always understand each other when we talk about KPIs even within the same company. It is sometimes possible that certain metrics are interpreted slightly differently within various departments.
For example, the taxonomy of products or product families can be called differently within the retail function and the e-commerce function.
The same thing happens when we share KPIs related to the e-commerce and digital world with non-digital functions.
It is important to define the objectives well.
FAQs
We can measure it through KPIs such as:
– The bounce rate: which measures the bounce rate of users. The Bounce Rate is a negative KPI so the goal is to reduce the Bounce rate;
– The number of pages per session (Pages / Session): which measures the number of pages viewed on average by users for each browsing session. This KPI can be used to measure engagement.
– The Conversion Rate, which measures the purchase conversion rate, that is the number of transactions over the number of sessions;
– The Average Order Value, which measures how much the channel’s customers spend on average, this KPI can be influenced both by ongoing promotional activities and by cross-selling and up-selling activities.
Yes, for example the competition over specific Keywords, like brand names in the fashion market, can push up the cost per click of Google Ads and decrease the ROAS, return on advertising spend.
Some KPIs are the same for example the Traffic, Conversion Rate, AOV, UPT and ASP, but that’s about it. The other KPIs are very different for a start the Return Rate it’s a KPI for Ecommerce but it isn’t for B&M Stores
I have read your writings and I have read articles on this topic in several articles from other sources. I got a lot of information from your writing, is there any other suggestions you can convey regarding the theme of your writing? so that I can get more and more complete information.