If you have been working in e-commerce long enough, you too have have probably arrived at the office one morning and saw from Google Analytics that the sales of your site have had an unexpected and significant drop.
What did you do then? Did you panic? Or did you open Google Analytics to hunt the cause of the drop? Did you find the problem? Here is how I go about hunting down the root cause.
I usually go to Google Analytics and look at these 5 reports :
1. Traffic sources , to check if there has been a drop in traffic from a particular acquisition channel;
2. Number of pages viewed per session, if they are decreasing there may be a navigation problem;
3. Number of products added to the carts, which can be determined by an assortment problem or a technical problem;
4. Transactions on different types of devices which tells me if the problem was on smart phones, tablets or desktops;
5. Checkout funnel , which tells me if there is a problem with the order completion flow.
1) If there has been a significant drop in site traffic, your transactions will likely have dropped accordingly and this could be the cause of the drop in revenue. The report that gives you the answer is the daily trend of visits or sessions which can be found in Audience> Overview , if the graph shows a sharp decline in sessions , taking a look at the Traffic Sources can explain many things, for example how digital and direct marketing campaigns are performing. If until the day before my campaigns brought me X thousands of Euros a day, what changed yesterday? Did I run out of budget for Adwords campaigns ?
To see if the drop in sales is due to campaigns that are not performing as expected, go to the Acquisition> All traffic report and then you can either draw the lines that interest you or make a comparison by date, selecting the option in the calendar : Compare with previous period. The report will now tell you how your traffic sources, CPC, organic, newsletter, are performing compared to the previous period.
If it doesn’t work as described you may have to make changes in the tracking parameters of your campaigns.
2) Pages viewed per session: if the visits are stable but there is a decline in the pages viewed per session, perhaps the interest in the products on your site has dropped or there is a problem with the usability of the site. Maybe an intervention on the site has compromised a button that is no longer clickable. Or that the site has suddenly become slow, which makes it difficult for users to navigate. an excess of traffic on the site could cause just that.
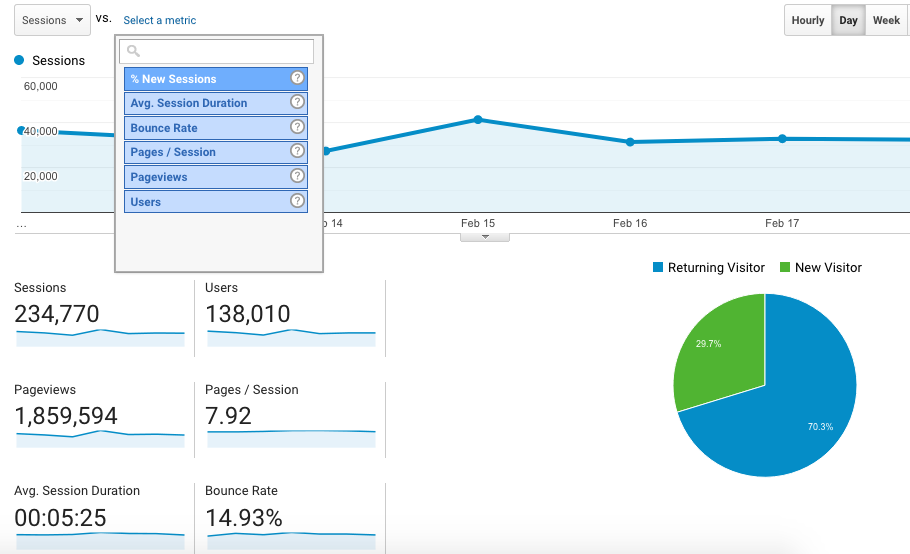
Usually to check the progress of the pages I go to the Audience> Overview report then I choose Pages / session from the selector with drop-down menu (see image)
3) Additions to the cart . If you track cart additions with a Google Analytics event (if you haven’t already, here’s a good reason to do so) and you see that there is a significant drop in this event, it may be that there is a technical problem on the site or that the stock is running out.
In the first case, unlikely but disastrous if it occurs, the add to cart button no longer works, in the second case it could be that some sizes or colors are out of stock , so users cannot find the product they are looking for.
4) Transactions on different types of devices . When you have a mobile version of the site or a responsive site, it is useful to know if the decline in sales has occurred on all types of devices, on a single category or on a particular model of smart phone.
To see this report, go to Audience > Mobile> Overview and look at the column with the ecommerce conversion rate, which shows the percentages for the different categories of devices: Desktop, Mobile, Tablet.
Devices can have different average conversion rates depending on the device or geographic area of reference, so it’s good to have an idea of what average values are acceptable for your brand.
5) The checkout funnel is the last part of the journey in acquiring the order, if you have not yet identified the cause of the drop in transactions, the answer may be here. If you have configured this report in Google Analytics, you also know what percentage of users on average successfully complete your checkout . If the percentage has dropped suddenly, the answer lies precisely in this path. It could be that your acquirer has had a (difficult) problem or that there is some other technical problem. Your best bet is to do a full test check out and see what’s wrong.
The report is located in Conversions> Goals> Funnel View and looks something like this.
Sometimes the decline in sales may be due to external factors that do not directly affect our site: it may be that we are at the end of the month and customers have run out of credit card limits, it may be that users are waiting for the sales or simply that it was a nice day and they went on a trip.
Finally, wait at least one day before panicking, usually if you have not encountered any of the problems listed above it may be that the following day you will see a rebound in sales!